Linear Roadmaps are Misleading

Linear roadmaps are misleading without a crystal ball for seeing the future. A roadmap that recognizes the existence of risk as time goes on is more honest. But an effective PM needs to anticipate possible branches, too – and create clear criteria for following each path.

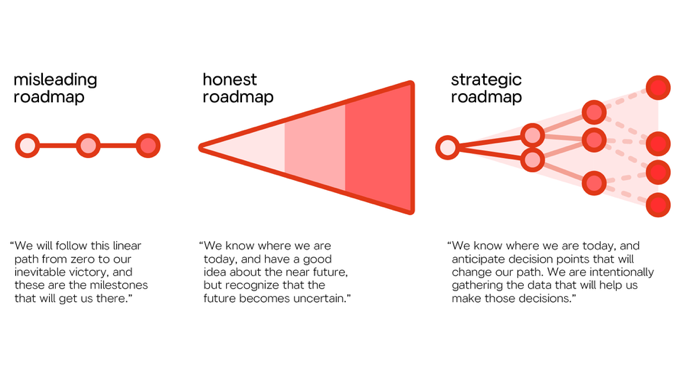
The second roadmap is a very good start, because it recognizes the existence of uncertainty. But that’s just the first step – the team should be actively working to reduce uncertainty. Make a plan: this is what we need to learn by this milestone to decide what to do next.

By being explicit about our plans for the future, we are not increasing risk or reducing agility. We open our ideas to critique and experimentation before they are set in stone, so that they can evolve with our understanding of opportunities.

It’s crucial to set success criteria at the beginning of the project: we know that we were successful if this metric is increased by that amount. But you should also have a plan for when it hasn’t, and find out before the last minute whether or not it’s working.

The temporal component in diagram 3 is virtual. The steps are not timeboxed: we know that hypothesis A will be followed by different experiments depending on whether it was confirmed, or we know we may achieve our OKR and will need to do something after, but we don’t know when.

The straight lines might be misleading; the dots are not meant to represent every milestone, merely those decision points that are known to be likely ahead of time. You may wander for some time before you reach them!

The one reason you may want to put features in the branches is if you’ve been pressured by senor management to acknowledge their pet idea. Clearly show that while it’s within the possibility space, there are conditions for reaching it. If they’re not met, it won’t happen.

The great thing about strategic roadmaps is that working backwards from “what do we need to learn” helps easily tie your work to tangible goals. The definition of “good” becomes “does is help us answer the question?” rather than “did management like it?”

The roadmap tweet lit up on LinkedIn again so it’s time to publish a small clarifying update.

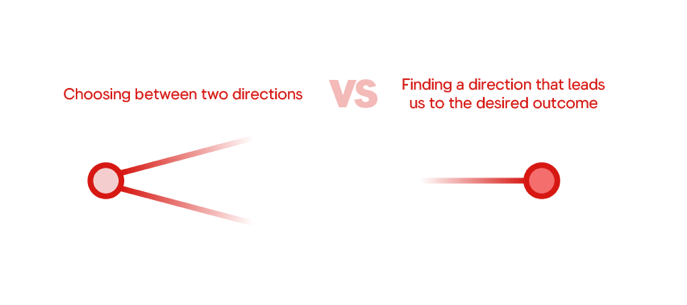
I’m seeing readers focus on the former aspect of the branching paths: “how do we make a decision?” But IMO the latter aspect is far more important: “how do we get where we want to go?”

From https://twitter.com/pavelasamsonov/status/1296818042928861184?s=61&t=rHrwF0m-o8nX1nk6oIOp6A

Better Experiments/Pilots

Scoping a pilot or experiment is often ignored and before you know it you have a production solution masquerading as a pilot. This article from John Cutler helps.

  1. Set aside ~90 minutes.
  2. Pick a problem or observation. 
  3. Read and discuss the dimensions described below. For each dimension, brainstorm example experiments representing the “extremes”. These don’t need to be real. Have fun.
  4. Optionally (as demonstrated with L+ and R+), chat about how the extremes could be considered positive.
  5. Return to the problem or observation. Ask individuals to brainstorm 1-3 candidate experiments to address that problem or observation. 
  6. Ask team members to individually describe each candidate experiment using the ranges below.
  7. As a group, discuss each experiment, and where each team member placed each experiment.
  8. Finally, ask team members to dot vote on the best-fit experiment (for the given context). Discuss ranking. Ideally, pick an experiment to try.

Local | Global

How containable (or localized) is the experiment?

L+: Localized impact, fewer dependencies, less visibility/oversight/meddling.

R+: Broader impact, more support, more visibility.

Flexible | Rigid

Will it be possible to pivot the experiment on the fly?

L+: May be easier to sustain. More adaptable to changing environments and new information.

R+:May be easier to understand, teach, support, and promote.

Short Duration | Long Duration

How long must the experiment last to provide meaningful information?

L+: Less disruptive. Easier to pitch. Faster feedback.

R+: More time to “simmer” and pick up steam. Commitment.

Invitation | Imposition

Will the participants be invited to take part in the experiment, or will the experiment be imposed?

L+: More intrinsic motivation. More vested in outcome. “Advocates for life!”

R+: Speed. Less need to “sell” change. 

Small Shift | Large Shift

Will the experiment represent a small change from how things currently work, or will it feel foreign and new? Perhaps different participants will experience different degrees of change.

L+: Easier. Less disruptive. More potential to “pick up momentum”.

R+: “Get it over with”. Less chance of getting stuck in local maximum.

Self-powering | Requires “fuel” & external support

Can the experiment sustain itself without outside support and resources, or will it require external support?

L+: Independent. Easier. Can be sustained indefinitely.

R+: Involves and “vests” broader group in the effort. 

Value in 2nd/3rd order effects | Risk in 2nd/3rd order effects

Second and third order effects are common when running an experiment. Is the experiment expected to “throw off” potentially valuable 2nd/3rd order effects? 

L+: Discover valuable things!

R+: Risk may be necessary to explore new areas of uncertainty.

Fewer dependencies, lower blast radius | 
More dependencies, higher blast radius

How independent/dependent is the experiment on other things (people, projects, systems, processes, etc.) in the org?

L+: Independent. More degrees of freedom. Less constrained.

R+: Potentially more impactful. Potentially more involvement and support.

Shorter feedback loops | Longer feedback loops

How easily and quickly can we get feedback?

L+: Can respond more quickly. Can pivot experiment more quickly.

R+: May be less noisy. May provide “deeper” or more cohesive information.

Low threat to formal structures/incentives | Challenges formal structures/incentives

Does the experiment represent a threat to formal power/incentive structures?

L+: Can fly under radar. Consider “safe” and non-threatening.

R+: May be less likely to test (and change) formal power/incentive structures.

From The Beautiful Mess – Better Experiments

Wardley Maps

A Wardley map is a map of the structure of a business or service, mapping the components needed to serve the customer or user. Wardley maps are named after Simon Wardley who claims to have created them in 2005. This form of mapping was first used in Fotango (a British Company) in 2005, within Canonical UK between 2008 and 2010 and components of mapping can be found in the Better For Less paper published in 2010.

Each component in a Wardley map is classified by the value it has to the customer or user and by the maturity of that component, ranging from custom-made to commodity. Components are drawn as nodes on a graph with value on the y-axis and commodity on the x-axis. A custom-made component with no direct value to the user would sit at the bottom-left of such a graph while a commodity component with high direct value to the user would sit at the top-right of such a graph. Components are connected on the graph with edges showing that they are linked.

Much of the theory of Wardley mapping is set out in a series of 19 blog posts and a dedicated wiki called Wardleypedia. As use of the technique has broadened to new institutions and been used to map new things the application of the technique in practice has drifted from the original vision.

Wardley Map Example

Links

Architecture Decision Record

An architectural decision record (ADR) is a document that captures an important architectural decision made along with its context and consequences.

What is an architecture decision record?

An architecture decision record (ADR) is a document that captures an important architectural decision made along with its context and consequences.

An architecture decision (AD) is a software design choice that addresses a significant requirement.

An architecture decision log (ADL) is the collection of all ADRs created and maintained for a particular project (or organization).

An architecturally-significant requirement (ASR) is a requirement that has a measurable effect on a software system’s architecture.

All these are within the topic of architecture knowledge management (AKM).

The goal of this document is to provide a fast overview of ADRs, how to create them, and where to look for more information.

Abbreviations:

  • AD: architecture decision
  • ADL: architecture decision log
  • ADR: architecture decision record
  • AKM: architecture knowledge management
  • ASR: architecturally-significant requirement

How to start using ADRs

To start using ADRs, talk with your teammates about these areas.

Decision identification:

  • How urgent and how important is the AD?
  • Does it have to be made now, or can it wait until more is known?
  • Both personal and collective experience, as well as recognized design methods and practices, can assist with decision identification.
  • Ideally maintain a decision todo list that complements the product todo list.

Decision making:

  • A number of decision making techniques exists, both general ones and software architecture specific ones, for instance, dialogue mapping.
  • Group decision making is an active research topic.

Decision enactment and enforcement:

  • ADs are used in software design; hence they have to be communicated to, and accepted by, the stakeholders of the system that fund, develop, and operate it.
  • Architecturally evident coding styles and code reviews that focus on architectural concerns and decisions are two related practices.
  • ADs also have to be (re-)considered when modernizing a software system in software evolution.

Decision sharing (optional):

  • Many ADs recur across projects.
  • Hence, experiences with past decisions, both good and bad, can be valuable reusable assets when employing an explicit knowledge management strategy.
  • Group decision making is an active research topic.

Decision documentation:

  • Many templates and tools for decisison capturing exist.
  • See agile communities, e.g. M. Nygard’s ADRs.
  • See traditional software engineering and architecture design processes, e.g. table layouts suggested by IBM UMF and by Tyree and Akerman from CapitalOne.

Decision guidance:

  • The steps above are adopted from the Wikipedia entry on Architectural Decision
  • A number of decision making techniques exists, both general ones and software and software architecture specific ones, for instance, dialogue mapping.

How to start using ADRs with tools

You can start using ADRs with tools any way you want.

For example:

  • If you like using Google Drive and online editing, then you can create a Google Doc, or Google Sheet.
  • If you like use source code version control, such as git, then you can create a file for each ADR.
  • If you like using project planning tools, such as Atlassian Jira, then you can use the tool’s planning tracker.
  • If you like using wikis, such as MediaWiki, then you can create an ADR wiki.

How to start using ADRs with git

If you like using git version control, then here is how we like to start using ADRs with git for a typical software project with source code.

Create a directory for ADR files:

$ mkdir adr

For each ADR, create a text file, such as database.txt:

$ vi database.txt

Write anything you want in the ADR. See the templates in this repository for ideas.

Commit the ADR to your git repo.

ADR file name conventions

If you choose to create your ADRs using typical text files, then you may want to come up with your own ADR file name convention.

We prefer to use a file name convention that has a specific format.

Examples:

  • choose_database.md
  • format_timestamps.md
  • manage_passwords.md
  • handle_exceptions.md

Our file name convention:

  • The name has a present tense imperative verb phrase. This helps readability and matches our commit message format.
  • The name uses lowercase and underscores (same as this repo). This is a balance of readability and system usability.
  • The extension is markdown. This can be useful for easy formatting.

Suggestions for writing good ADRs

Characteristics of a good ADR:

  • Point in Time – Identify when the AD was made
  • Rationality – Explain the reason for making the particular AD
  • Immutable record – The decisions made in a previously published ADR should not be altered
  • Specificity – Each ADR should be about a single AD

Characteristics of a good context in an ADR:

  • Explain your organization’s situation and business priorities
  • Include rationale and considerations based on social and skills makeups of your teams

Characteristics of good Consequences in an ADR::

  • Right approach – “We need to start doing X instead of Y”
  • Wrong approach – Do not explain the AD in terms of “Pros” and “Cons” of having made the particular AD

A new ADR may take the place of a previous ADR:

  • When an AD is made that replaces or invalidates a previous ADR, a new ADR should be created

ADR example templates

ADR example templates that we have collected on the net:

For more information

Introduction:

Templates:

In-depth:

Tools:

Examples:

See also:

From https://github.com/joelparkerhenderson/architecture_decision_record

Technical Debt

Software systems are prone to the build up of cruft – deficiencies in internal quality that make it harder than it would ideally be to modify and extend the system further. Technical Debt is a metaphor, coined by Ward Cunningham, that frames how to think about dealing with this cruft, thinking of it like a financial debt. The extra effort that it takes to add new features is the interest paid on the debt.

Martins Fowlers description of Technical Debt

The metaphor of debt is sometimes used to justify neglecting internal quality. The argument is that it takes time and effort to stop cruft from building up. If there new features that are needed urgently, then perhaps it’s best to take on the debt, accepting that this debt will have to be managed in the future.

The danger here is that most of the time this analysis isn’t done well. Cruft has a quick impact, slowing down the very new features that are needed quickly. Teams who do this end up maxing out all their credit cards, but still delivering later than they would have done had they put the effort into higher internal quality. Here the metaphor often leads people astray, as the dynamics don’t really match those for financial loans. Taking on debt to speed delivery only works if you stay below the design payoff line of the Design Stamina Hypothesis, and teams hit that line in weeks rather than months.

There are regular debates whether different kinds of cruft should be considered as debt or not. I found it useful to think about whether the debt is acquired deliberately and whether it is prudent or reckless – leading me to the Technical Debt Quadrant.

Technical Debt Quadrant

From https://martinfowler.com/bliki/TechnicalDebt.html.

See also The Human Cost of Technical Debt – the human side of the problem.  And, make no mistake — in business, all human problems are also business problems,viewed with a wide enough lens.  Unhappy humans are unhappy workers, and unhappy workers are less productive.  Yet, this angle of technical debt is seldom discussed, in my experience.

  • Unpleasant Work
  • Team Infighting
  • Atrophied Skills
  • The Hidden Business Cost: Turnover and Attrition

7 habits for developing a Technical Architect Mindset

  1. Decisions are not dichotomies of either/or.
    It’s not clicks or code, its clicks and code, or clicks at first, and then replacement with code. Or too much code, for the wrong reason, or too many clicks, for the right non-functional performance requirements. Some questions aren’t ‘Should I do this in clicks or code’ its ‘Should we do this at all’ or ‘What happens if I do it this way?’
  2. Becoming an Architect isn’t a destination.
    It’s a progressive journey that does not end. It may reach an inflection point (with a job title), but it’s not a mountain you climb where you reach the top and gaze down on the world below.
  3. You can’t study all the answers, but you can seek the experience.
    There is no book of ready-made answers to every situation. There are only things you see and hear and read. Ideas picked up from colleagues, war stories told by clients or friends, that project that failed, that idea that didn’t work out, that thing that succeeded. You do it over and over and over. The study gives you ingredients but cooking the meal, that comes from experience.
  4. There are no right answers. There are principles to learn and apply.
    There are better or worse answers, depending on the circumstances. Do you know all the circumstances? Have you considered the options for the answers? Do you know the questions to ask?
  5. It’s not about being ‘right’
    Indeed, you might not know if the design has succeeded or failed until years later. What was a success could be declared a failure with changing business conditions, changing assumptions, changing politics, changing technology. Often the right answer isn’t easily seen, it is simply your answer, supported by the reasons you can articulate and accepting the trade-offs you know come with it. If you think you are the smartest person in the room… then you are on your way to failure. Staggering insecurity is a feature, not a bug.
  6. The idea is the easy part, the persuasion is where all the work is.
    Can you convince a room full of people they are looking at the problem the wrong way? Can you justify your choices with the right props? Can you use diagrams, analogies, examples, stories, a raised voice or a timely question to win over a group of people?
  7. More here: https://www.youtube.com/watch?v=ND-dX-__I1Y&t=528s

From https://limitexception.com/another-7-habits-for-developing-a-technical-architect-mindset-448c9f3fec13

Learn to spot Unicorns

Horns, horses and wings exist.

Unicorns do not.

Just because you can talk about “proactive infrastructure”, a “dynamically configurable platform”, or “contextually aware flow routing”, doesn’t mean they exist.

There are a lot of folk out there selling Unicorn architectures.

Learn to subject proposed architectures to common-sense, plain-English reality checks.

7 Key Enterprise Architecture Metrics

Enterprise Architecture is still an emerging field. There are not many organizations today that are effectively measuring their EA program with metrics. Here are a few metrics that might work:

IT Total Cost of Ownership (TCO) as a Percentage of Revenue
One of EA’s value propositions is reducing costs by leveraging common solutions and rationalizing processes, technology and data.
This metric is key to the business value achieved by the IT stack. It has appeal to business stakeholders and allows IT costs to be compared with industry or regional averages.
Example: The total cost of ownership of IT is 4.8% of revenue.

Total Cost Savings (TCS)
Often EA is able to achieve cost savings by:

  • retiring a legacy system 

  • consolidating licensing 

  • introducing common shared services 

  • rationalizing infrastructure investment 
etc…
    If the EA team can deliver cost savings on a regular basis — Total Cost Savings is a meaningful metric for EA.
    Example: EA initiatives saved the organization 5.2 million dollars this quarter.

Percentage Of Spend That’s Strategic (PSTS)
The EA team assesses all projects and designates them as tactical or strategic. The percentage of the total IT spend that was considered strategic can then be calculated using project budget information.
PSTS is a good predictor of the long term heath and efficiency of IT. However, it may be of little interest to the business.
Example: 47% of project spending went to strategic projects this quarter.

Common Services Compliance Rate (CSCR)
Enterprise Architecture often defines common services such as ESB, BPM, Infrastructure platforms etc… The CSCR measures the percentage of new projects that are fully compliant with the common service roadmap.
Example: 67% of projects complied with EA’s common service strategy this year.

Architectural Due Diligence Rate (ADDR)
The percentage of projects that are fully compliant with the EA governance 2 process. A EA governance process involves steps such as updating EA blueprints, architectural reviews and macro design.
ADDR is a good metric for reporting violations of the EA process. It is often helpful to report ADDR by business unit, technology silo or project manager — to highlight problem areas.
Example: 78% of operations department projects complied with EA governance but only 12% of sales department projects were in compliance.

Sunset Technology (ST)
Percentage of the technology stack that is considered sunset by EA. Measures IT’s ability to introduce strategic technology and retire legacy systems.
Example: At the end of the year 54% of production systems were deemed sunset technologies. This compares with 62% last year.

Business Specific
Manage EA with specific metrics aligned with your business strategy and goals. Examples include:

  • reducing time to market for launching new products 

  • reducing human error rates 

  • speeding up order delivery 

  • reducing IT costs 

  • reducing severity and frequency of security incidents
    Example: average time to market for introducing a new product decreased from 5.8 months last year to 4.9 months this year.
    Significant and measurable business goals that require EA support make good EA metrics.

The 3 Types of EA Metrics

There are 3 fundamental ways to measure the performance of your EA team:

1. Measure IT
IT metrics are well established — ROI, Total Cost of Ownership, Mean Time to Repair (MTTR) etc..

Such IT metrics are SMART and appeal to the business. They are good measures for IT — but do they translate to EA?

In theory the EA team should be able to increase ROI for IT, reduce Total Cost of Ownership etc… However, there are many factors affecting these measures. The correlation between EA performance and IT metrics may be low.

2. Measure EA Governance
It is relatively easy to measure the success of IT governance. What percentage of projects complied with governance? What percentage of projects were rejected? The problem with these metrics is that they lack appeal for the business.

It is not obvious how governance metrics translate into competitive advantage, customer experience or cost savings.

3. Measure EA Itself
Measuring EA directly is the ideal way to score the EA team. The problem is it is tricky to develop such metrics. The EA team collaborates with business, solution and governance teams.

The fact is that it is difficult to assign a number to collaborative long term planning activities such as EA.

EA is Strategic Planning

Enterprise Architecture quite simply is all about Strategic Planning. It helps enterprises shape their future structure and dynamics in the face of the changing environment in which they do business. Its purpose is to understand the ends and means that form the strategies needed.

How does an enterprise react to events that do and will potentially occur and arrive at the strategies needed to remain robust, efficient and viable, to continue to deliver value and make profits for themselves?

Enterprise Architecture is the corporate discipline that helps us to understand the questions that need to be asked and get better at strategic thinking. The approach is based on asking the usual Why, What, How, When, Who and Where questions:

  • Why does the enterprise need to change?
  • What are the drivers for change?
  • Are the drivers fully understood?
  • What is the mission and purpose of the enterprise?
  • What do enterprises need to do and need to understand? What do their customers and stakeholders want?
  • What is possible to do?
  • What are the strategies, goals and objectives?
  • How will these be achieved?
  • What business capabilities are needed?
  • When should the enterprise react to new opportunities? What are the potential business scenarios that might occur? How will the enterprise react when they do occur? And how should it react?
  • Who should be involved?
  • Where is the enterprise?
  • What environment or markets is it located in?
  • How many different environments are there?
  • What would success look like for strategic planning?

These should all be open questions. You should take care that the questions don’t upset those executives that are responsible for the current answers and are asked in an ego-less fashion.

All of these answers can be modelled and analysed with your favourite enterprise architecture tool.  I like to add a Strategy domain to the usual Business Architecture, Information Architecture, Application Architecture and Infrastructure Architecture domains.

Enterprise Architects should start to think like a strategist instead of just like a technologist.

From https://ingenia.wordpress.com/2013/01/20/ea-is-strategic-planning/