Linear Roadmaps are Misleading

Linear roadmaps are misleading without a crystal ball for seeing the future. A roadmap that recognizes the existence of risk as time goes on is more honest. But an effective PM needs to anticipate possible branches, too – and create clear criteria for following each path.

The second roadmap is a very good start, because it recognizes the existence of uncertainty. But that’s just the first step – the team should be actively working to reduce uncertainty. Make a plan: this is what we need to learn by this milestone to decide what to do next.

By being explicit about our plans for the future, we are not increasing risk or reducing agility. We open our ideas to critique and experimentation before they are set in stone, so that they can evolve with our understanding of opportunities.

It’s crucial to set success criteria at the beginning of the project: we know that we were successful if this metric is increased by that amount. But you should also have a plan for when it hasn’t, and find out before the last minute whether or not it’s working.

The temporal component in diagram 3 is virtual. The steps are not timeboxed: we know that hypothesis A will be followed by different experiments depending on whether it was confirmed, or we know we may achieve our OKR and will need to do something after, but we don’t know when.

The straight lines might be misleading; the dots are not meant to represent every milestone, merely those decision points that are known to be likely ahead of time. You may wander for some time before you reach them!

The one reason you may want to put features in the branches is if you’ve been pressured by senor management to acknowledge their pet idea. Clearly show that while it’s within the possibility space, there are conditions for reaching it. If they’re not met, it won’t happen.

The great thing about strategic roadmaps is that working backwards from “what do we need to learn” helps easily tie your work to tangible goals. The definition of “good” becomes “does is help us answer the question?” rather than “did management like it?”

The roadmap tweet lit up on LinkedIn again so it’s time to publish a small clarifying update.

I’m seeing readers focus on the former aspect of the branching paths: “how do we make a decision?” But IMO the latter aspect is far more important: “how do we get where we want to go?”

From https://twitter.com/pavelasamsonov/status/1296818042928861184?s=61&t=rHrwF0m-o8nX1nk6oIOp6A
Better Experiments/Pilots

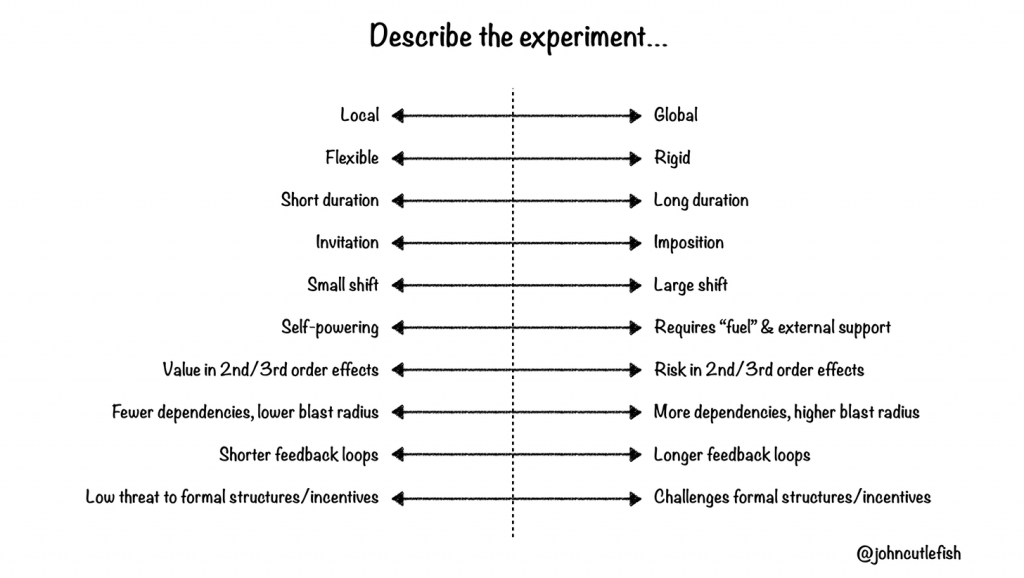
Scoping a pilot or experiment is often ignored and before you know it you have a production solution masquerading as a pilot. This article from John Cutler helps.

  1. Set aside ~90 minutes.
  2. Pick a problem or observation. 
  3. Read and discuss the dimensions described below. For each dimension, brainstorm example experiments representing the “extremes”. These don’t need to be real. Have fun.
  4. Optionally (as demonstrated with L+ and R+), chat about how the extremes could be considered positive.
  5. Return to the problem or observation. Ask individuals to brainstorm 1-3 candidate experiments to address that problem or observation. 
  6. Ask team members to individually describe each candidate experiment using the ranges below.
  7. As a group, discuss each experiment, and where each team member placed each experiment.
  8. Finally, ask team members to dot vote on the best-fit experiment (for the given context). Discuss ranking. Ideally, pick an experiment to try.

Local | Global

How containable (or localized) is the experiment?

L+: Localized impact, fewer dependencies, less visibility/oversight/meddling.

R+: Broader impact, more support, more visibility.

Flexible | Rigid

Will it be possible to pivot the experiment on the fly?

L+: May be easier to sustain. More adaptable to changing environments and new information.

R+:May be easier to understand, teach, support, and promote.

Short Duration | Long Duration

How long must the experiment last to provide meaningful information?

L+: Less disruptive. Easier to pitch. Faster feedback.

R+: More time to “simmer” and pick up steam. Commitment.

Invitation | Imposition

Will the participants be invited to take part in the experiment, or will the experiment be imposed?

L+: More intrinsic motivation. More vested in outcome. “Advocates for life!”

R+: Speed. Less need to “sell” change. 

Small Shift | Large Shift

Will the experiment represent a small change from how things currently work, or will it feel foreign and new? Perhaps different participants will experience different degrees of change.

L+: Easier. Less disruptive. More potential to “pick up momentum”.

R+: “Get it over with”. Less chance of getting stuck in local maximum.

Self-powering | Requires “fuel” & external support

Can the experiment sustain itself without outside support and resources, or will it require external support?

L+: Independent. Easier. Can be sustained indefinitely.

R+: Involves and “vests” broader group in the effort. 

Value in 2nd/3rd order effects | Risk in 2nd/3rd order effects

Second and third order effects are common when running an experiment. Is the experiment expected to “throw off” potentially valuable 2nd/3rd order effects? 

L+: Discover valuable things!

R+: Risk may be necessary to explore new areas of uncertainty.

Fewer dependencies, lower blast radius | 
More dependencies, higher blast radius

How independent/dependent is the experiment on other things (people, projects, systems, processes, etc.) in the org?

L+: Independent. More degrees of freedom. Less constrained.

R+: Potentially more impactful. Potentially more involvement and support.

Shorter feedback loops | Longer feedback loops

How easily and quickly can we get feedback?

L+: Can respond more quickly. Can pivot experiment more quickly.

R+: May be less noisy. May provide “deeper” or more cohesive information.

Low threat to formal structures/incentives | Challenges formal structures/incentives

Does the experiment represent a threat to formal power/incentive structures?

L+: Can fly under radar. Consider “safe” and non-threatening.

R+: May be less likely to test (and change) formal power/incentive structures.

From The Beautiful Mess – Better Experiments

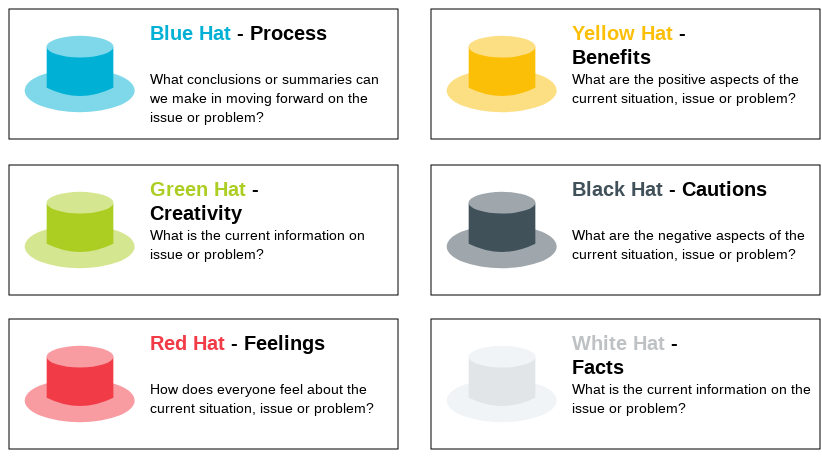
Six Thinking Hats

Six Thinking Hats was written by Dr. Edward de Bono. “Six Thinking Hats” and the associated idea parallel thinking provide a means for groups to plan thinking processes in a detailed and cohesive way, and in doing so to think together more effectively.

Although this can be used in groups to aid thinking assigning each person a role has felt restrictive for me. Better example – group assumes all roles at the same time so you move through the different hats together. Also find it useful if going through thinking on my own and avoids falling into favouring your own idea and focussing on yellow and blue hats while missing the others.

Wardley Maps

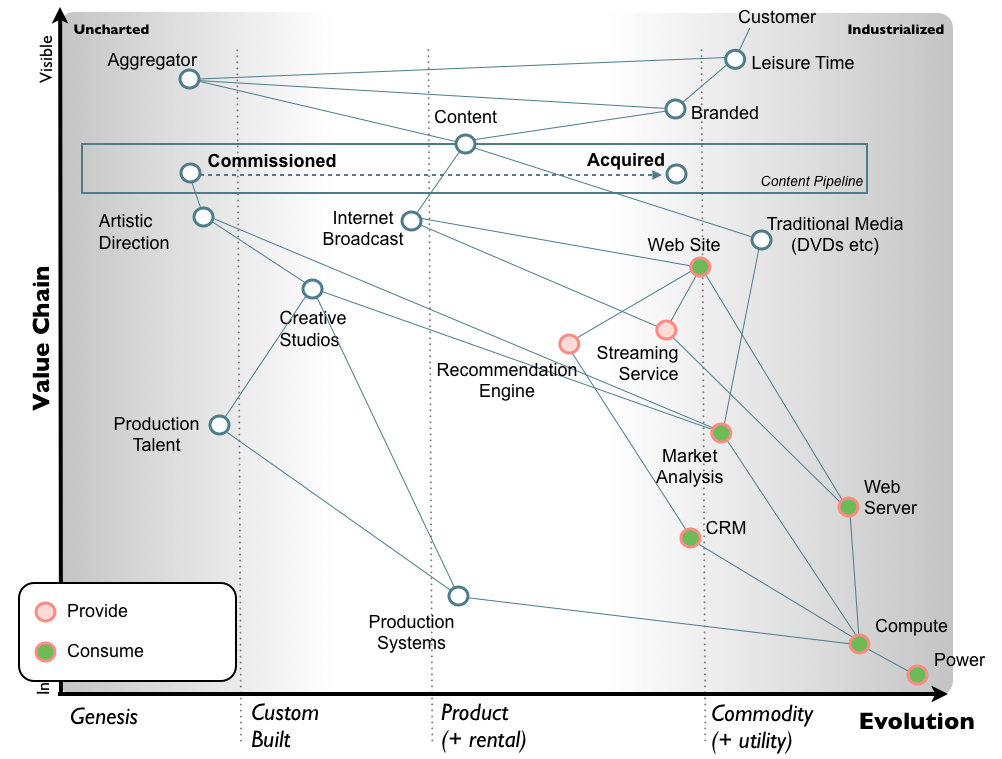
A Wardley map is a map of the structure of a business or service, mapping the components needed to serve the customer or user. Wardley maps are named after Simon Wardley who claims to have created them in 2005. This form of mapping was first used in Fotango (a British Company) in 2005, within Canonical UK between 2008 and 2010 and components of mapping can be found in the Better For Less paper published in 2010.

Each component in a Wardley map is classified by the value it has to the customer or user and by the maturity of that component, ranging from custom-made to commodity. Components are drawn as nodes on a graph with value on the y-axis and commodity on the x-axis. A custom-made component with no direct value to the user would sit at the bottom-left of such a graph while a commodity component with high direct value to the user would sit at the top-right of such a graph. Components are connected on the graph with edges showing that they are linked.

Much of the theory of Wardley mapping is set out in a series of 19 blog posts and a dedicated wiki called Wardleypedia. As use of the technique has broadened to new institutions and been used to map new things the application of the technique in practice has drifted from the original vision.

Wardley Map Example

Links

Capture, organize, synthesize

Takeaway from a Mozilla user study studying how people find, save and share things on the web:

  1. Capture as much as possible. Capture without judgment: your thoughts are more valuable than paper. Externalize what you learn. Once an idea is captured in a tangible form you can begin surveying and manipulating it.
  2. Organize only after you capture. Filter, but don’t delete irrelevant information. Computers are big enough to search and store everything. Make them manage it.
  3. Synthesize into new meaning. Re-contextualize what you learn. This is the creative act. Experience becomes art, notes become a novel.

Most creative bottlenecks happen when you try to organize and synthesize before you capture. Spread it all out before you try to arrange it.


Many creative tools are designed for organizing first. Name the file before you can write in it. Create your Photoshop layer before you can draw on it. This causes friction.


From http://gordonbrander.com/pattern/capture-organize-synthesize/